4-1.5 Recognize the correct placement of variables on a line graph.
4-1.6 Construct and interpret diagrams, tables, and graphs made from recorded measurements and observations.
Diagrams, Tables, and Graphs
Essential Question: How can information from recorded measurements and observations be displayed and communicated?
Suppose that you have gathered and recorded data in an investigation. Now you need to organize your data, or arrange them in some kind of order. Then the data will be easier to understand and to share with others.
Using Diagrams
Scientists often use diagrams to organize and share data. A diagram is a drawing that shows information. A diagram should always have a title, labels, and a caption.
A diagram can show the parts of something or the order of events. Some diagrams show how things are alike and different. Some show how objects or events are related to each other.
Using Tables and Graphs
Data are often measurements. Scientists organize these data in different ways. One way is in a data table. A data table is a chart made up of rows and columns.
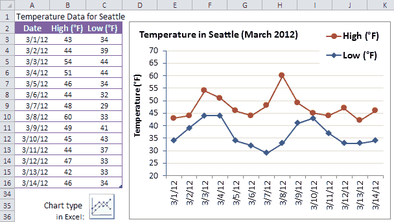
The table shows temperature date. The table makes it easier to look at the data. Read across each row to see the high and low for each date.
Notice that each column has a heading showing what was measured and the unit of measurement.
You should plan a data table before you start an investigation. Draw the rows and columns. Write in the column headings. You may wish to include qualitative data, describe in words. If so, be sure to leave room for writing.
Now look at the graph next to the table. The graph shows the same data in a different way. This kind of graph is called a line graph. A line graph shows data as a line across a grid.
A line graph shows how the manipulated variable and the responding variable are related. The bottom edge of the graph always shows the manipulated variable. This part of the graph is called the x-axis. The left edge of the graph always shows the responding variable. This part of the graph is called the y-axis.
The numbers along each axis are called a scale. Each scale shows quantities, or amounts, for the variable that was measured. Each dot represents a single measurement. The line connects the measurements.
Line graphs make it easy to see patterns of change. A quick look at the graph above shows you that volume increases as temperature goes up. A line graph is also a good way to show how something changes over time.
Another kind of graph is a bar graph. A bar graph is a graph that shows numbers as bars of different lengths.
A bar graph makes it easier to compare quantities. You compare data by comparing the lengths of the bars. Look at the bar graph below. You can see quickly that kids have more fish as pets.
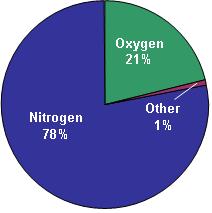
You can use a circle graph to show data as parts of a whole. A circle graph is sometimes called a pie chart. It looks like a pie cut into different-size slices. Each slice represents a part of a whole. All the slices together equal the whole, or 100 percent.
The circle graph below shows the gases that make up the air around us. You can easily see that air is mostly nitrogen and oxygen. Other gases make up only a small fraction, or part.
A pictograph uses pictures of objects to show quantities. The key shows what kind of data each picture represents. You read the graph by counting the number of each kind of picture. For example, there were 6 Smarties counted during this lesson. (see example)
Essential Question: How can information from recorded measurements and observations be displayed and communicated?
Suppose that you have gathered and recorded data in an investigation. Now you need to organize your data, or arrange them in some kind of order. Then the data will be easier to understand and to share with others.
Using Diagrams
Scientists often use diagrams to organize and share data. A diagram is a drawing that shows information. A diagram should always have a title, labels, and a caption.
A diagram can show the parts of something or the order of events. Some diagrams show how things are alike and different. Some show how objects or events are related to each other.
Using Tables and Graphs
Data are often measurements. Scientists organize these data in different ways. One way is in a data table. A data table is a chart made up of rows and columns.
The table shows temperature date. The table makes it easier to look at the data. Read across each row to see the high and low for each date.
Notice that each column has a heading showing what was measured and the unit of measurement.
You should plan a data table before you start an investigation. Draw the rows and columns. Write in the column headings. You may wish to include qualitative data, describe in words. If so, be sure to leave room for writing.
Now look at the graph next to the table. The graph shows the same data in a different way. This kind of graph is called a line graph. A line graph shows data as a line across a grid.
A line graph shows how the manipulated variable and the responding variable are related. The bottom edge of the graph always shows the manipulated variable. This part of the graph is called the x-axis. The left edge of the graph always shows the responding variable. This part of the graph is called the y-axis.
The numbers along each axis are called a scale. Each scale shows quantities, or amounts, for the variable that was measured. Each dot represents a single measurement. The line connects the measurements.
Line graphs make it easy to see patterns of change. A quick look at the graph above shows you that volume increases as temperature goes up. A line graph is also a good way to show how something changes over time.
Another kind of graph is a bar graph. A bar graph is a graph that shows numbers as bars of different lengths.
A bar graph makes it easier to compare quantities. You compare data by comparing the lengths of the bars. Look at the bar graph below. You can see quickly that kids have more fish as pets.
You can use a circle graph to show data as parts of a whole. A circle graph is sometimes called a pie chart. It looks like a pie cut into different-size slices. Each slice represents a part of a whole. All the slices together equal the whole, or 100 percent.
The circle graph below shows the gases that make up the air around us. You can easily see that air is mostly nitrogen and oxygen. Other gases make up only a small fraction, or part.
A pictograph uses pictures of objects to show quantities. The key shows what kind of data each picture represents. You read the graph by counting the number of each kind of picture. For example, there were 6 Smarties counted during this lesson. (see example)
|
|
|
